Hybrid work is changing how we measure productivity and engagement. Old metrics like hours logged or desk occupancy don’t work anymore. Instead, businesses need smarter ways to track outcomes and improve team performance. Here’s what you need to know:
- Key Metrics to Track:
- Planned to Done Ratio: Measures task completion rates to identify productivity trends.
- Focus-Time Ratio: Tracks uninterrupted work periods for better efficiency.
- Employee Net Promoter Score (eNPS): Gauges employee satisfaction and loyalty.
- Voluntary Turnover Rate: Helps spot retention issues in hybrid teams.
- Revenue per Employee: Links employee output to business success.
- Why Metrics Matter:
- Spot burnout risks (e.g., after-hours communication above 20% leads to higher turnover).
- Improve collaboration (teams with 4+ hours of daily overlap complete projects 26% faster).
- Optimize office spaces based on real usage.
- Challenges:
- Balancing data collection with employee privacy.
- Avoiding vanity metrics and focusing on actionable insights.
- Getting Started:
- Start small with 3–4 key metrics.
- Use tools like Worklytics or Hubstaff for automated tracking.
- Regularly review and refine your approach.
Bottom Line: Measuring hybrid workforce performance is about outcomes, not activity. Focus on metrics that align with your goals – whether it’s boosting productivity, retaining talent, or cutting costs. The right data can help you make better decisions for your hybrid team.
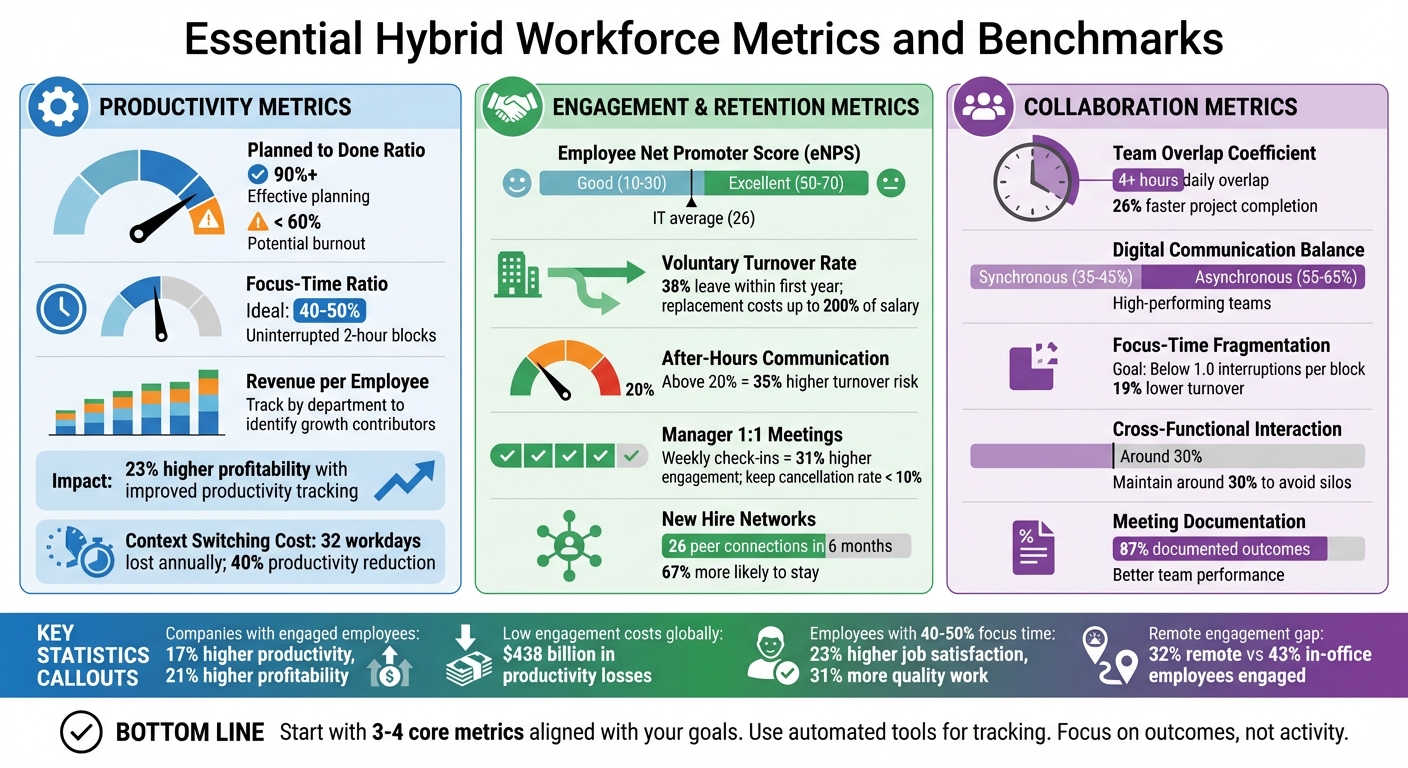
Essential Hybrid Workforce Metrics and Benchmarks
7-Minute Workshop: Managing the Productivity of a Hybrid Workforce
Productivity Measurement Metrics
Measuring productivity in hybrid teams calls for a shift away from outdated metrics like hours worked or desk presence. Instead, these three metrics offer a clearer picture of how well your distributed workforce is performing.
Planned to Done Ratio
The Planned to Done Ratio measures the percentage of tasks that employees complete within a given timeframe. To calculate it, divide the number of completed tasks by the total number of assigned tasks, then multiply by 100. For instance, if an employee completes 45 out of 50 tasks in a week, their ratio is 90%.
This metric emphasizes results over time spent. A ratio above 90% suggests effective planning and reliable execution, while one below 60% may point to issues like burnout, overloading, or shifting priorities. Research shows that companies improving productivity tracking can achieve 23% higher profitability and 17% better overall performance.
"The planned-to-done ratio measures how much work is assigned to an employee and how much of it gets done, revealing patterns that pure output numbers might miss."
Regular tracking helps distinguish individual challenges from broader workflow issues. For example, if one employee consistently scores 50% while others maintain 90%, it signals a need for targeted support. On the other hand, if an entire department has low ratios, it may indicate unclear goals or understaffing. Tracking how long tasks take to complete adds further clarity to team efficiency.
Average Task Completion Time
Measuring task completion time uncovers bottlenecks and inefficiencies in hybrid workflows. Instead of focusing on isolated tasks, this metric identifies patterns, making it particularly useful for distributed teams.
On average, employees lose 32 workdays annually switching between apps and need 23 minutes to refocus after a distraction. Frequent context switching can reduce overall productivity by as much as 40%.
Time-tracking tools can categorize activities, such as "content creation" or "report preparation", to reveal where time is being spent during the workday. For complex tasks, uninterrupted focus periods of at least two hours are critical for faster project completion in hybrid setups. Combining this data with communication analytics can help pinpoint delays caused by slow feedback or departmental silos. Beyond operational efficiency, financial metrics provide another layer of productivity evaluation.
Revenue per Employee
As operational efficiency improves, financial metrics like Revenue per Employee become essential for assessing the success of a hybrid work model. This metric is calculated by dividing total revenue by the number of full-time equivalent (FTE) employees. It shifts the focus from physical presence to overall business outcomes in hybrid environments.
Engaged employees often drive higher revenue, showcasing the value of focusing on outcomes. Globally, low employee engagement costs businesses an estimated $438 billion in productivity losses.
"Measuring productivity by profit means that if revenue increases while inputs stay constant, the employees become more productive."
- Gable Team
To gain deeper insights, segment this metric by department to identify which areas contribute most to growth in a hybrid setting. Pair revenue data with quality metrics like customer satisfaction to ensure employees maintain service standards alongside productivity gains. Establishing a baseline over several months helps account for workload fluctuations.
Employee Engagement and Retention Metrics
Understanding how employees feel about their work environment is just as important as tracking their productivity. Keeping an eye on engagement and retention metrics can help prevent early talent loss. Let’s dive into three key metrics that reveal whether your hybrid work model is supporting workforce stability.
Employee Net Promoter Score (eNPS)
The eNPS is a straightforward way to measure employee loyalty. It’s based on one simple question: “On a scale of 0–10, how likely are you to recommend this company as a place to work?” Responses are grouped into three categories: Promoters (9–10), Passives (7–8), and Detractors (0–6). To calculate your score, subtract the percentage of Detractors from the percentage of Promoters.
Here’s what the numbers mean:
- A score between 10 and 30 is good.
- A score between 50 and 70 is excellent.
The average eNPS across organizations typically falls between 12 and 14, but this can vary by industry. For example, Information Technology averages 26, while Healthcare averages –6.5. Companies with engaged employees see tangible benefits, including 17% higher productivity and 21% higher profitability.
"The metric offers a glimpse into how happy and satisfied your employees are and the likelihood of them staying and promoting your company to others."
- Gem Siocon, Digital Marketer and Content Writer, AIHR
To get the most out of eNPS, segment the data by remote and in-office employees. For instance, only 32% of remote employees report feeling engaged compared to 43% of in-office workers. Pair the score with an open-ended follow-up question like, “What is the primary reason for your score?” to gain deeper insights. Conduct these surveys regularly to capture shifts in employee sentiment.
Voluntary Turnover Rate
Voluntary turnover is a strong indicator of how well your hybrid work culture is functioning. To calculate it, divide the number of voluntary departures by the average number of employees, then multiply by 100.
Here are some stats to consider:
- 38% of employees leave within their first year.
- Replacing an employee can cost up to 200% of their annual salary when factoring in hiring, training, and lost productivity.
Breaking turnover data down by department, manager, or tenure can help identify specific issues. For example, if your tech team has an 8–10% turnover rate but retail teams are at 25–30%, the problem might be tied to working conditions in specific areas rather than company-wide challenges. Tracking "regrettable attrition" – the loss of top performers – can also highlight departures that have a bigger impact on team morale and productivity.
Hybrid teams with after-hours communication rates above 20% are 35% more likely to experience higher turnover. Monitoring workday intensity (the ratio of digital work time to total work time) can help flag early signs of burnout. Additionally, employees with a focus-time ratio of 40–50% report 23% higher job satisfaction, and companies with engaged teams experience 59% lower turnover.
360-Degree Feedback
While numerical metrics like eNPS and turnover rates are important, 360-degree feedback adds another layer by offering a well-rounded view of employee performance and collaboration. Unlike traditional reviews, this method collects input from peers, managers, and even customers to assess how well employees are performing in hybrid settings.
Here’s an interesting finding: New hires who interact with 26 peers in their first six months are 67% more likely to stay. However, since the pandemic, the size of these networks has shrunk by nearly 50%. This highlights the need to focus on relationship-building. Companies with strong cross-team connections also report 25% more innovative solutions to business challenges.
To encourage collaboration, set goals for employees to build 3–5 meaningful cross-functional connections each quarter. Regular one-on-one meetings with managers are another key driver of engagement – hybrid teams with weekly check-ins report 31% higher engagement. Keep the cancellation rate for these meetings below 10% to ensure employees feel supported and visible. During onboarding, collaboration analytics can be particularly helpful for assessing an employee’s internal network, as 20% of new hires leave within their first 45 days.
Collaboration and Resource Utilization Metrics
Measuring collaboration and resource use is just as important as tracking individual productivity in a hybrid work model. These metrics reveal whether your setup is helping employees thrive or creating unseen challenges. For instance, they can highlight if team members are bogged down by endless meetings or if office spaces are underutilized.
Collaboration vs. Focus Time
Balancing teamwork with uninterrupted work is one of the toughest aspects of hybrid work. The Focus-Time Ratio tracks how much of the workday is spent in uninterrupted blocks of at least two hours. These blocks are vital for tackling complex tasks, and the ideal range is 40–50% of the day. Employees who achieve this balance report 23% higher job satisfaction and produce 31% more quality work.
On the flip side, too many meetings can be a major drain. In fact, 47% of employees say excessive meetings waste their time. The Focus-Time Fragmentation Index measures how often focus blocks are interrupted. Keeping interruptions below 1.0 per block has been linked to 19% lower voluntary turnover rates.
Another useful metric is the Digital Communication Balance Index, which tracks the ratio of synchronous communication (meetings, calls) to asynchronous methods (emails, Slack, project tools). High-performing teams aim for 35–45% synchronous communication and 55–65% asynchronous. This balance helps prevent burnout from constant meetings while keeping teams aligned. Teams that document outcomes for 87% of their meetings outperform those that do so for only 41%.
The Team Overlap Coefficient measures how many hours a day team members are available for real-time collaboration, accounting for time zones and schedules. Teams with at least four hours of daily overlap complete projects 26% faster and report 34% better collaboration satisfaction. Without sufficient overlap, response times can stretch beyond four hours. To address this, consider strategies like "meeting-free afternoons" or batching less urgent communications.
These metrics not only highlight how teams collaborate digitally but also set the stage for optimizing physical workspaces, which we’ll dive into next.
Office Utilization Rates
Even in a hybrid model, tracking how physical office spaces are used remains critical. Since 71% of employees say collaboration is their main reason for coming into the office, understanding space usage helps companies make better real estate decisions. Metrics like Office Occupancy and Density use sensors and booking systems to monitor how much space is occupied and the number of employees per square foot. This data ensures spaces aren’t overcrowded or left empty, helping you optimize your office footprint.
Space Allocation Analysis examines the balance between private offices, shared workspaces, and meeting rooms. By tracking demand, companies can adjust layouts to match actual usage. For example, if meeting rooms are always booked but individual desks are empty, converting some desks into shared spaces or "hoteling" areas might be a smart move. This approach reduces costs while ensuring the office supports both focus and collaboration.
Metrics now also evaluate the quality of in-office interactions. Research shows that employees working near high-performing colleagues tend to improve their own performance. While scheduled meetings are easy to track, proximity data can shed light on spontaneous, informal interactions that often spark innovation. These insights help ensure your office fosters the kind of dynamic connections that drive success.
sbb-itb-8132e49
How to Implement Hybrid Workforce Metrics
How to Select the Right Metrics
Start by defining what success looks like for your organization – whether that’s keeping top talent, cutting costs, or improving teamwork. These goals will determine which metrics deserve your attention. For instance, if reducing employee turnover is your focus, you’ll want to track engagement scores and voluntary turnover rates. On the other hand, if cutting real estate costs is the priority, office utilization data will be key.
Use the SMART framework (Specific, Measurable, Achievable, Relevant, Timely) to weed out metrics that might look good on paper but don’t actually drive results. For example, tracking total hours logged might seem useful, but a metric like the Focus-Time Ratio – showing how much uninterrupted time employees have for deep work – offers more actionable insights.
Bring in key stakeholders from HR, IT, and facilities management early in the process. Their input helps you identify what’s working and what’s not from multiple angles. Combine hard data, like task completion rates, with qualitative feedback from tools like 360-degree surveys to get a balanced view. Start small by piloting a few critical metrics, such as focus efficiency and the frequency of manager one-on-ones, to avoid overwhelming your team.
"The key to success lies in tracking metrics that actually move the needle for hybrid teams." – Worklytics
Tools for Tracking Metrics
The right tools make metric tracking seamless by pulling data automatically from systems you already use. For example, platforms like Worklytics connect to email, calendar, and chat tools to provide anonymized insights into workflow patterns – no constant surveys required. Time tracking tools like Hubstaff can give you real-time data on activity rates, hours worked, and project budgets, all through customizable dashboards.
Make sure your tools integrate smoothly with project management, communication, and HR systems to avoid manual data entry and ensure accuracy. Look for platforms that combine data from multiple sources while prioritizing employee privacy with features like anonymization and compliance with privacy laws like GDPR and CCPA. Once your tools are set up, schedule regular check-ins to refine your approach as needed.
Regular Review and Benchmarking
Set up a structured review process to keep your metrics aligned with your goals. Weekly reports can help you catch short-term trends, while quarterly reviews are better for benchmarking against industry standards. Assign responsibility for each metric to the relevant department – HR can manage turnover rates, for example, while IT might handle metrics related to collaboration tools.
Take a phased approach to implementation. In the Foundation phase, establish baseline metrics and set up your analytics tools. During the Optimization phase, look for areas to improve and test targeted strategies. Finally, in the Scale phase, roll out the metrics across all departments and integrate them into formal performance reviews. Align these phases with your overall hybrid workforce strategy to ensure both remote and in-office teams benefit.
Benchmarks should evolve over time. For instance, by 2025, a Focus-Time Ratio of 40–50% is expected to be the norm for high-performing teams, and weekly manager one-on-ones should have a cancellation rate below 10%. Adjust your targets based on industry trends, company growth, and employee feedback. Use automated alerts to flag significant changes – like a spike in after-hours communication above 15% – so you can address issues quickly.
"Think of hybrid work KPIs as the vital signs for your company’s operational health." – Viva Team, Execviva
Advanced Analytics for Hybrid Workforce Optimization
Advanced analytics take workforce metrics to the next level by not only measuring current performance but also predicting future trends and calculating financial returns. These tools turn data into actionable insights, helping organizations refine their hybrid workforce strategies.
Calculating ROI of Hybrid Workforce Models
Advanced analytics make it possible to quantify the financial impact of hybrid work by focusing on four main areas: meeting efficiency, burnout prevention, onboarding improvements, and real estate savings.
For example, by multiplying the average hourly salary by the hours saved from cutting unnecessary meetings, companies often see a 15–25% reduction in meeting time through data-driven changes. Similarly, tracking workday intensity and after-hours communication allows businesses to identify burnout risks before they lead to costly resignations, which can range from $15,000 to $75,000 per employee.
Onboarding processes also benefit from analytics. By monitoring new hire networks, organizations can improve time-to-productivity by 40%. Employees who establish 26 peer connections within six months are 67% more likely to remain with the company after their first year.
Real estate savings are another key area. By analyzing office usage data, such as badge swipes and desk bookings, companies can adjust their desk-to-employee ratios. For a 10,000-employee organization, investing in workplace analytics can pay off in as little as 1.1 to 4.4 months.
"The answer lies in data-driven ROI calculations that account for measurable improvements in meeting efficiency, reduced burnout, and enhanced productivity." – Philip Arkcoll, Founder, Worklytics
These ROI metrics pave the way for predictive analytics, which can offer even deeper insights into workforce dynamics.
Using Predictive Analytics for Decision-Making
Predictive analytics build on ROI data to help organizations foresee and address challenges before they escalate. Tools like Organizational Network Analysis (ONA) analyze collaboration patterns across emails, chats, and calendars to identify silos and inefficiencies without relying on constant employee surveys. For instance, a cross-functional collaboration rate below 30% can signal unhealthy team isolation. Meanwhile, teams with at least four hours of daily synchronous overlap complete projects 26% faster.
Workday intensity modeling dives deeper by tracking active work hours, after-hours communication, and fragmented focus time. This helps predict burnout risks and identify employees who may need support. For new hires, predictive tools analyze early peer connections during the first 90 days, enabling timely interventions when social networks are lacking. Notably, 97% of analysts now use AI to document the ROI of workplace analytics investments.
Aligning Metrics with Management by Objectives (MBO)
To ensure data-driven strategies align with broader goals, linking metrics to Management by Objectives (MBO) is essential. This approach shifts the focus from inputs, like hours worked, to measurable outputs and results – especially critical for managing distributed teams.
Setting SMART targets (e.g., closing 10 sales deals per quarter) and tracking outcomes (like achieving a 70% meeting-to-outcome ratio) can lead to 31% higher engagement, 24% better performance, and 22% faster project completion. Employees who spend 40–50% of their workday in focused work also produce 31% more high-quality results.
To streamline this process, project management tools can integrate with analytics platforms, automatically aligning daily activities with strategic objectives. Regular reviews ensure these metrics stay relevant as hybrid work models evolve.
Conclusion
Summary of Key Metrics
When evaluating hybrid workforce performance, it’s crucial to focus on results rather than activity. Metrics like the Focus-Time Ratio (ideally 40–50% of the workday) and the Planned to Done Ratio are excellent indicators of productivity. For engagement, the frequency of manager 1:1 meetings stands out as a strong predictor of employee retention, especially in distributed teams. Additionally, maintaining cross-functional interaction rates at around 30% can help avoid silos, while keeping after-hours communication below 15% serves as a key signal for managing burnout risks.
Organizations that adopt these metrics often experience measurable improvements, including a 15–25% boost in project completion times and a 20–30% drop in employee turnover. Metrics tied to peer connections also play a significant role in retaining new hires. Together, these indicators not only provide insights into productivity and engagement but also guide strategic adjustments for managing hybrid teams effectively. By embracing data-driven approaches, companies can achieve impactful results.
Final Thoughts on Managing Hybrid Teams
Effective hybrid team management relies on fostering both transparency and trust. As hybrid work continues to grow – projected to include 36.2 million Americans (14% of adults) working from home by the end of 2025 – metrics will be essential for balancing flexibility with performance. With 86% of employees advocating for legal requirements around disclosing monitoring tools, open communication about data collection is critical. The aim isn’t surveillance – it’s creating an environment that empowers employees.
Start by focusing on 3–4 core metrics aligned with immediate objectives, and expand gradually as needs evolve. Train managers to use data for coaching rather than micromanaging, and implement "no-meeting" blocks to protect focus time. Ensuring at least four hours of daily synchronous overlap can significantly enhance team collaboration. As Philip Arkcoll, Founder & CEO of Worklytics, puts it:
"The challenge isn’t just tracking activity – it’s identifying which metrics actually drive business outcomes and team effectiveness".
Ultimately, the best organizations use metrics as tools to eliminate obstacles, improve employee well-being, and align everyday actions with broader strategic objectives. Metrics, when applied thoughtfully, can transform hybrid work into a model that benefits both employees and businesses.
FAQs
How do I choose the 3–4 best hybrid work metrics for my goals?
To identify the top 3–4 hybrid work metrics for your organization, start by connecting them directly to your goals. Consider what success looks like for your team – whether it’s improved productivity, higher employee satisfaction, or better use of office space. Choose metrics that are specific, measurable, and actionable. Some examples include:
- Employee productivity
- Job satisfaction
- Space utilization
- Communication effectiveness
Focus on metrics that provide consistent and useful insights, helping you make informed decisions that enhance both performance and the employee experience.
How can we track hybrid workforce metrics without violating employee privacy?
Tracking hybrid workforce metrics effectively means striking a balance between gaining insights and respecting employee privacy. Instead of resorting to intrusive practices like keystroke monitoring, focus on anonymized and aggregated data. This approach allows you to identify patterns in areas like collaboration, focus time, and communication trends without compromising individual privacy.
Use tools designed with privacy in mind and ensure transparency about what data is being collected and why. It’s also crucial to align your tracking methods with privacy laws and secure employee consent. This not only ensures compliance but also helps build trust within your team.
What benchmarks should we use for focus time, overlap hours, and after-hours messaging?
Focus time should ideally account for 40-50% of the workday, giving employees the space to concentrate deeply on their tasks. Overlap hours should be structured around team collaboration needs, ensuring smooth and effective communication during shared working times. To encourage a healthy work-life balance, after-hours messaging should stay below 15% of total communications. These guidelines are designed to boost productivity while prioritizing employee well-being.